Managing Sewage Demand and Holiday Demand

November 26, 2009

When it rains it pours – that is, sewage overflows into streams, rivers and lakes and then into our beaches and drinking water (yuck!).   (NY Times 11/22/09)  For example, cases of serious diarrhea at one Milwaukee hospital increase when local sewers overflowed.

The problem with our old sewage systems is that they are capable of handling normal “loads”, but when it rains, the demand on the system exceeds capacity. With no place to inventory the excess water, it is spilled into local waterways.

So what is the solution when peak demand exceeds capacity? The knee jerk reaction is to increase capacity. But this can be foolish – it can be very costly to increase capacity when it will be used only at peak demand times. A better strategy is to smooth out the demand peak.  Of course, we can’t control rain, so that won’t work. But we can slow down the flow of rain into the sewage system by how we design our cities. In particular, planting trees helps to absorb the flow of water (maybe we can interpret this as an increase in capacity). Planting organic roofs can also slow down the flow of water – instead of rushing off the roof, it drips from the roof.  Or, if we could design sewage systems so that rain water was processed in a different system than toilet water, then the peak demand problem is solved – peak rain water can be safely spilled into the river and it would be unlikely to have a coordinated demand peak of toilet water, i.e., separate smooth demand from the variable demand. (I never did believe the stories about the problems induced when too many people flush during a Super Bowl commercial.)   

So what is the connection between sewage and holiday demand? Retailers face the peak demand problem in spades. The following graph plots sales of general merchandizers from 1992 to 2008 and clearly illustrates the annual holiday spike in demand

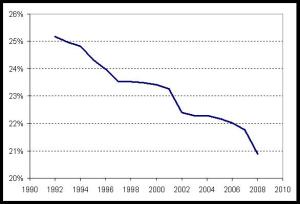
An interesting feature of this paper, contrary to what you hear in the press, is that the end-of-year spike is actually getting smoother. To illustrate, the following graph shows the % of annual demand that occurs in November and December:

From a peak of 25%, the fraction of annual sales occurring in November and December has been steadily declining, and now is about 21%.  Why is this? It could be that consumers want to smooth their consumption (they can’t wait for that holiday present) or it could be that retailers are encouraging this demand smoothing (via pricing). 

Another change in the data is the “back to school effect” – August’s sales relative to September’s sales has been showing a steady increase. Back-to-school is now the mini-Christmas of the year.


Buy now! Limited supplies!

November 19, 2009

Related to my post yesterday, the NY Times today has an article on retailers intentionally keeping stocking quantities low (NY Times, 11/19/09, Luxury Stores Trim Inventory and Discounts).  If the Brioni leather bomber jacket is what you need for that special someone this season, you better get to Saks fast because they have only 1 left – at a mere $5295! (And then you need to see a therapist to explore why you feel compelled to spend $5295 + taxes on an article of clothing which is not suitable for climbing Mt Everest or walking on the moon.)

The idea is simple – intentionally stock less than a “normal” amount so that you will not have too much inventory left over which needs to be discounted. Because if you have too much inventory left over, then customers may anticipate this and not plop down $5K to buy at the regular price, thereby certainly ensuring that you will have to discount.  Or, you are doing this to generate a sense of scarcity, and therefore desirability:

“What’s luxury retailing all about?” Mr Sadove said. “It’s about a scarcity of supply.”

Given that we are talking about ultra luxury products, I wonder if the scarcity argument holds water. If you are spending $5K on a jacket, then you better be sure that you will never see another person walking down 5th Avenue with that jacket on. But only people walking down 5th Avenue would be willing to spend that kind of money on a jacket (i.e., not everyone has the same probability of encountering another person with this jacket on). So unless that jacket is *unique*, it is not scarce enough.

Next, the standard approach to avoid markdowns with luxury goods is to not markdown! A $5K jacket probably has a very healthy margin (say $4,750), so if you have a few left over, then ship them back to the producer, take more time to sell them, or burn them. But whatever you do, don’t markdown the price! Having a few left over jackets that need to be sold in some other country with the label ripped out may be cheaper than stocking out when somebody wants to pay you an obscene amount (ok, I’ll stop harping about the ridiculousness of the price).

The article recognizes that the best approach is to start with a limited supply and then replenish only if necessary. This is feasible in some categories (contemporary apparel and women’s shoes) but not in others (European designers). Of course, this reminds us of Zara:

The graph above nicely illustrates the Zara strategy – start with a more reasonable price and a limited quantity, replenish if necessary, and don’t mark down all that much.  The net effect is that your total profit (light blue) can be higher.

And there is one key lesson from Zara that is missing in the discussion of Saks.  If Zara runs out of one item, they generally have another item available that is a close substitute. If you like a particular black bomber jacket at Zara, then you should buy it because (a) it will not be marked down and (b) if you wait then you will have to buy a different black jacket.  Either way, Zara gets the sale. In the NY Times article, they are suggesting that it can be better to simply stock out.  If you don’t have an adequate substitute, then that is really a costly strategy.  Being smart doesn’t mean you are willing to incur costs. Being smart is avoiding costs while maximizing revenue.


4Q is time for what’s hot and unavailable

November 19, 2009

Every 4th quarter there are stories about what is hot and hard to find. This year, it is the e-reader category, specifically Sony’s Daily Edition Reader ($399) and Barnes & Noble’s Nook ($259). (See WSJ 11/18/09 – Sony Says Some E-Reader Orders May Miss Christmas).  Sony is telling customers that they are now shipping orders on Dec 18th – a little tight to ensure being included as a stocking stuffer.

My favorite quote from the article is:

“The possibility that Sony, a huge electronics manufacturer, would be caught off guard by supply-chain issues is surprising, said Mike Serbinis, president of Shortcovers

The presumption is that an experienced and large manufacturer should not have any trouble matching supply with demand. This simply ignores the fact that size and experience are no match for the uncertainties of the market.

Next, it is interesting that Sony is capable of quoting shipping dates:

“In October, the company told its first wave of customers that the Nook would ship Nov. 30. A second wave of customers was told it would ship Dec. 7; shipping dates of Dec. 11 and Dec. 18 were later given.”

This does demonstrate a sophisticated level of supply chain management, assuming their quotes are reasonably accurate: to be able to do this requires a significant amount of real-time information sharing across the supply chain and the skill to process that information quickly.

Finally, I can’t help but speculate on whether they intentionally kept supplies short. Suppose you think you could sell 100,000 units. If you make 75,000, they you are likely to run short. If demand turns out to be 120,000, you are really short and you get lots of free press about how hot your product is. But to make that strategy work, loosing thousands in sales has to cost you less than the free advertising. Hard to say if it is worth it.  Then again, it is entirely possible that if your new techno gadget isn’t “hot”, then it becomes “stone cold”. For example, if “natural” demand is 100,000 but you make 75,000, then actual demand turns out to be 125,000.  If “natural” demand is 100,000 but you make 100,000, then actual demand turns out to be 60,000 because who wants to buy a product that isn’t popular.


H1N1 Production and Forecasts

November 9, 2009

eggsThe following table provides a summary of the H1N1 vaccine forecasts and actual availability:

Date Forecast (million doses) Actual
7/30/09 120 by October.  
9/12/09 50 by Oct. 15,   
9/26/09 40  by mid October  
10/17/09 28-30 by the end of October. 11.4
10/26/09 30 by the end of October  
10/28/09   23.2

Why the error in their forecasts? My favorite quote (NY Times Oct 25, 2009) is

Dr. Thomas R. Frieden, the director of the Centers for Disease Control and Prevention, “We really thought that having five different manufacturers would buy us some insurance, that they wouldn’t all have problems.”

The implicit assumption in this quote is that yields would be independent across flu manufacturers.  This may be true if yield primarily depends on manufacturing choices that could differ across the 5 manufacturers. But the manufacturers all used the same seed stock (the virus injected into eggs that is suppose to replicate within the eggs to make the vaccine).  Consequently, if the seed stock isn’t very good, it doesn’t matter if you have one manufacturer or 100! If you are going to diversity your risk by choosing multiple suppliers, then you should make sure that their yields are uncorrelated. (On a related point, there was no shortage of nasal spray vaccine, because they had a much higher yield … and used a different seed stock.)

There are some other reasons for the errors.  In July the forecast was based on an assumption of a high yield. However, the actual yield would not be known until the first batches were completed in August. Therefore, it seemed premature to put any faith in the July forecast without better information.

So why were the September forecasts wrong? The government basically asked the manufacturers’ for their forecasts, and not surprisingly, they got optimistic numbers. I am not saying the manufacturers lied. Instead, they probably thought it was possible that they could improve yields quickly enough to make the numbers. For example Sanofi Pasteur’s initial yield was 1.5 doses per egg and they did manage to increase it to 3 doses per egg.

Some of the shortfall was due to shortages in parts. For example, MedImmune, maker of the nasal vaccine, had more vaccine than it could put into nasal sprayers (their yield was apparently 5 times higher than expected), despite having their supplier of nasal sprayers work 3 shifts, 7 days a week.

Finally, one of the manufacturers, from Australia, satisfied Australian demand first.

The lesson from all of this, dare I say, is “don’t count your chickens before they have hatched”! Production yields are uncertain, and the government could have benefited from learning more about what determines those yields, when information would be learned about those yields and relying less on manufacturers’ forecasts.